The Problem
JVM memory issues can be a huge pain to diagnose. They are often caused by transient requests or large/unusual payloads. The Java garbage collector may eventually resolve the situation, but in the meantime, spiking CPU increases latency and hurts the customer experience. Capturing the heap dump and garbage collection statistics is key for debugging the underlying cause, and all too often, people forget to capture these metrics.
Capturing heap dump and garbage collection data is usually a nightmare and no one wants to watch a bunch of SSH windows hoping to catch the leak occurring.
The Solution
Shoreline solves the problem quickly and effectively.
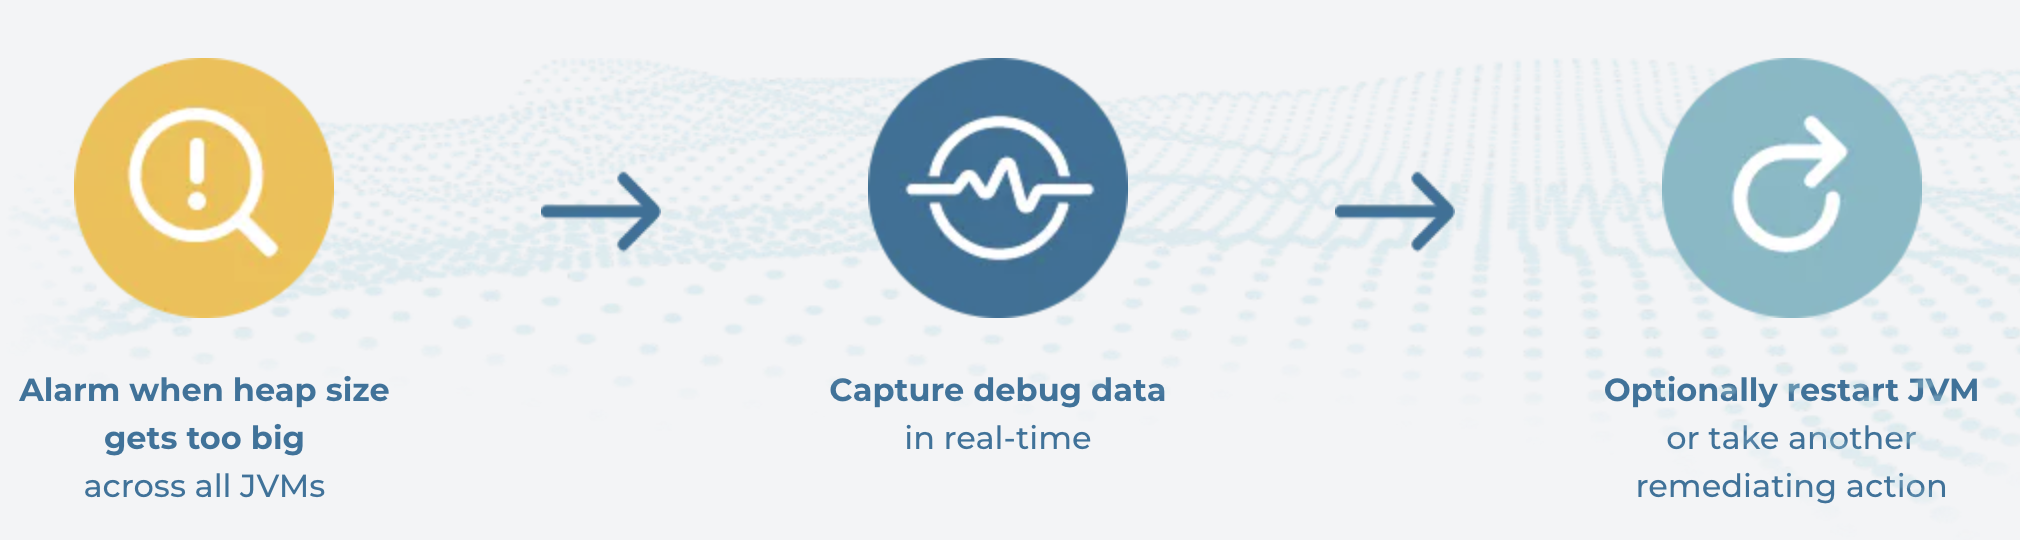
Shoreline automates all of this, saving engineers hours of work while immediately fixing the customer experience. Shoreline continuously monitors the JVM heap size and triggers an alarm if the heap size exceeds a configurable threshold.
Once the alarm fires, Shoreline automatically captures heap dump, thread dump, GC stats, and other debug data. Customers can choose to push this data to Amazon S3, Google storage, or any other object store before optionally restarting the JVM. This process completes in seconds, ensuring the least possible impact on the customer experience. Shoreline saves you hours of exploratory work and eliminates engineering frustration trying to identify a root cause without enough information.
About Shoreline
Shoreline is helping software engineers and site reliability engineers take the toil out on-call. We make it easy to debug new issues in the moment and then automate them away forever. Shoreline runs across clouds, VMs, and containers and lets you manage your fleet as if it were a single box. Shoreline is working with large and hyper-growth companies like Dataiku, Domino Data Lab, TigerGraph, and Incorta.
Shoreline gives users a path to automation with a CLI for debugging and immediate issue resolution. Shoreline allows users to capture a debug and repair session in a Jupyter-style notebook built for on-call. Then, share notebooks with your entire team to safely fix issues using a list of pre-approved repair actions. Finally, when you are confident that you have precisely matched the repair action to the alarm, you can automate away common issues permanently.
Shoreline provides many pre-built automations, called Op Packs, that any customer can use. Shoreline is offering the JVM Op Pack for free so that users can eliminate JVM memory issues permanently.